I was able to collect sensor data (temperature, humidy, pressure) for a while and send the data out via MQTT. What I never finished is to display the data in a nice graphical UI. Unfortunately to do this via Internet and any hosted service (e.g. Adafruit, or AWS or Google), a requirement is to use TLS (HTTPS or MQTT over TLS). Not a problem in general, but for an ESP8266 with Espruino and about 20 KByte RAM available for user programs, the TLS stack is way too large and RAM consuming. See here. ESP32 is better (512 KByte RAM ionstead of 80 KByte in total) and it could do TLS, but I have 1 ESP32 and about 10 ESP8266 modules...
Thus I am forced to use simple and unencrypted MQTT locally with a local MQTT broker. One subscriber process can get updates and send to an Internet connectable service (i.e. the many IoT related services there are). There the data is stored and displayed.
But then I thought that instead of sending the data to another hosted DB, I can instead host a small DB myself. I can run a time series DB and a graphical front-end. E.g. ELK stack or InfluxDB & Grafana. See here for a short comparison of ElasticSearch vs. InfluxDB. For the latter I found a very useful Docker Compose setup here, so InfluxDB & Grafana it was!
How to create users in InfluxDB
Grafana should only have read-only access. The submit process should only have a write-only access. Create those users:
CREATE USER submit WITH PASSWORD 'submitpw';
GRANT WRITE ON demo TO submit;
CREATE USER grafanaro WITH PASSWORD 'testro';
GRANT READ ON demo TO grafanaro;
Then there's the DB root account of course which you can find in the docker-compose.yml file.
How to submit data into InfluxDB
This simple shell script will do and quickly generate some moderately useful data:
#!/bin/bash
pingAvg=`ping -c 5 router.lan | tail -1 | awk -F/ '{print $5}'`
curl -i -XPOST 'http://influxdb.lan:8086/write?db=demo' -u submit:submitpw --data-binary 'ping router='$pingAvg
Run it at least twice as Grafana won't display much if there's only one data point. Then configure a panel on a new dashboard in Grafana:
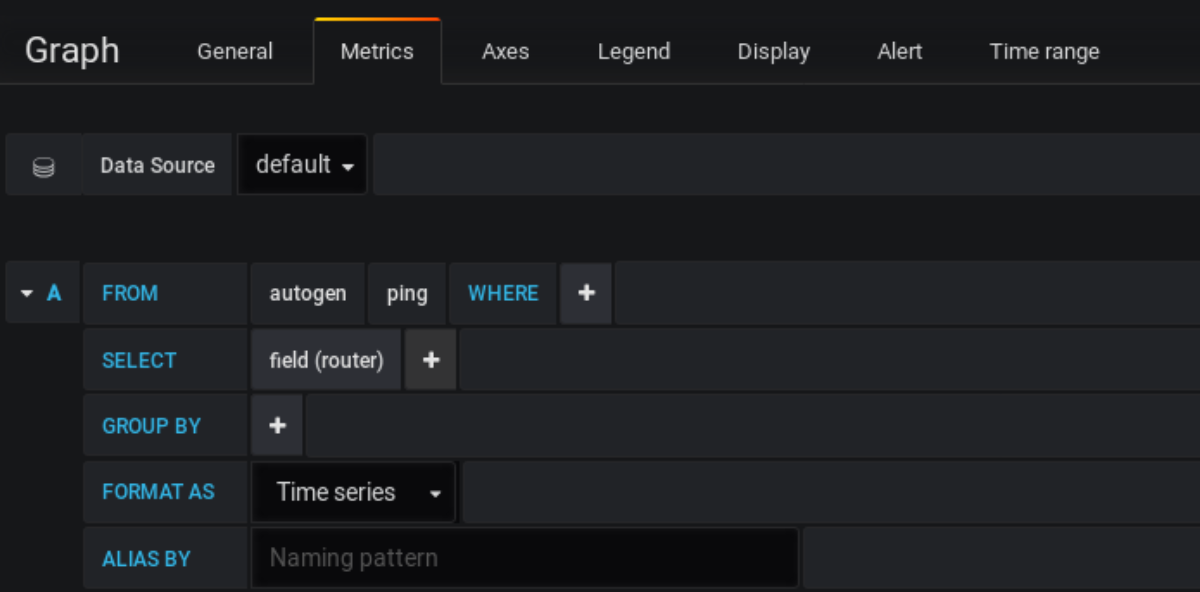
Reload the graph, set the time frame to the last 15min, and you should see something which proves that data ingestion works.
Next step
Create a small program to subscribe data updates from the MQTT broker and send it securely to InfluxDB.